Student Achievement
Public Disclosure of Student Achievement
The Southern Association of Colleges and Schools Commission on Colleges (SACSCOC) Principles of Accreditation Standard 8.1 (Student Achievement) requires institutions to identify, evaluate, and publish goals and outcomes for student achievement appropriate to the institutions’ s mission, the nature of the students it serves, and the kinds of programs offered. It also indicates that the institution should use multiple measures to document student success. Requirements for publications are further specified in the SACSOC Policy on Institutional Obligations for Public Disclosures.
GTCC has established thresholds and goals for each Key Performance Indicator (KPI). These have been established using the same methodology employed by North Carolina for calculating the baseline and excellence levels in State Performance Measures. Threshold/Baseline and Goal/Excellence levels are based on the past three years of our Peer Comparison College data. The Threshold/Baseline is two standard deviations below the peer comparison group mean and Goal/Excellence is one standard deviation above the peer comparison group mean.
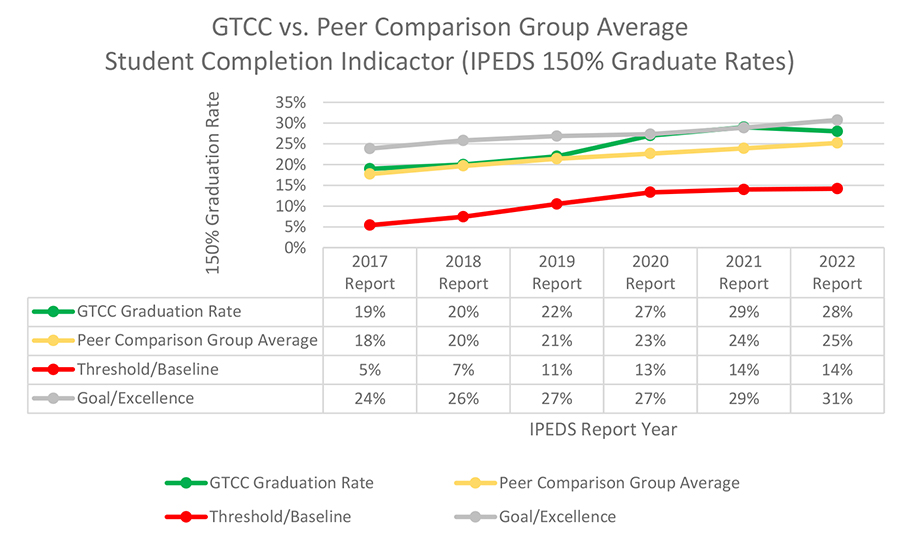
SACSCOC Student Completion Metric: IPEDS 150% Graduation Rate
Integrated Postsecondary Education Data System (IPEDS) 3-year graduation rates for first-time, full-time students is one of several measures that GTCC monitors closely. The data feedback reports above provide GTCC with disaggregated data by race/ethnicity, gender, and Pell status. GTCC selected a group of peer institutions for benchmarking and comparison purposes that were representative of size, demography, and Pell status.
IPEDS Data Feedback Reports which are available one year after the data are reported are linked here: 2023, 2022, 2021, 2020.
North Carolina State Performance Measures
Guilford Technical Community College additionally utilizes the State Performance Measures provided annually by the North Carolina Community College System. To comply with North Carolina General Statute 115D-31.3, the North Carolina Community College System (NCCCS) annually collects data from the 58 community colleges in the state and measures each college on a defined set of measures. A major component of the current State Performance Measures Model that includes outcome funding is the establishment of system-wide baseline and excellence levels for each measure. Each was statistically defined and developed to provide consistency, transparency, simplicity, and objectivity across the state and measures.
An index score of 1.0 is the System Average. Baseline levels are set two standard deviations below the system’s average index score and excellence levels are set one standard deviation above the system’s average index scores. The average band is within 0.5 standard deviations above or below the average index score.
Table 1: 2023 North Carolina State Performance Measures Results
| State Performance Measure | GTCC Index Score | System Baseline Index Score | System Average Band Minimum Index Score | System Average Band Maximum Index Score | System Excellence Level Index Score |
|---|---|---|---|---|---|
| Basic Skills Progress Measure | 0.904 | 0.527 | 0.884 | 1.122 | 1.241 |
| Student Success Rate in College-Level English Courses | 0.915 | 0.723 | 0.934 | 1.074 | 1.144 |
| Student Success Rate in College-Level Math Courses | 0.913 | 0.626 | 0.910 | 1.100 | 1.194 |
| First-Year Progression | 0.994 | 0.874 | 0.971 | 1.035 | 1.067 |
| Curriculum Student Completion | 0.990 | 0.850 | 0.968 | 1.046 | 1.086 |
| Licensure and Certification Passing Rate | 1.015 | 0.806 | 0.938 | 1.026 | 1.069 |
| College Transfer Performance | 0.971 | 0.871 | 0.954 | 1.009 | 1.036 |
NCCCS Performance Measures for Student Success Summary Reports: 2023, 2022, 2021, 2020
North Carolina State Performance Dashboards with further disaggregation can be found here:
Data Dashboards — NCCCS (nccommunitycolleges.edu)
Voluntary Framework of Accountability
GTCC began participation in the Voluntary Framework of Accountability (VFA) in 2020 as it is aligned with the college’s Guided Pathways philosophy and provides national peer comparisons on key student success momentum points. Specifically, GTCC selected the Two-Year Success measure to serve as a measure of Student Achievement. Comparison Colleges have been selected based on being similar in size, enrollment intensity, enrollment of minorities, developmental education referrals, and based in a city or suburb. The same methodology for establishing baselines and targets has been employed for the three cohorts measured by the VFA for the Two-Year Success Measure. The three cohorts are:
- Main Cohort — defined as full and part-time students taking classes for the first time at the institution after high school graduation
- Credential Seeking Cohort — defined as a subset of the main cohort who earn 12 hours in two years
- First Time at College Cohort — a subset of the Main Cohort and no prior college history after high school graduation
| 2020 Report | 2021 Report | 2022 Report | 2023 Report | |
|---|---|---|---|---|
| GTCC | 64.3% | 66.0% | 62.5% | 65.4% |
| Peer Comparison Group Average | 64.2% | 64.2% | 65.2% | 66.6% |
| Threshold/Baseline | 61.2% | 61.2% | 62.2% | 63.6% |
| Goal/Excellence | 65.7% | 65.7% | 66.7% | 68.1% |
| 2020 Report | 2021 Report | 2022 Report | 2023 Report | |
|---|---|---|---|---|
| GTCC | 88.0% | 89.7% | 88.3% | 89.9% |
| Peer Comparison Group Average | 87.6% | 87.6% | 85.9% | 88.6% |
| Threshold/Baseline | 83.6% | 83.6% | 81.9% | 84.6% |
| Goal/Excellence | 89.6% | 89.6% | 87.9% | 90.6% |
| 2020 Report | 2021 Report | 2022 Report | 2023 Report | |
|---|---|---|---|---|
| GTCC | 62.5% | 64.0% | 59.7% | 64.1% |
| Peer Comparison Group Average | 63.0% | 63.0% | 63.5% | 66.9% |
| Threshold/Baseline | 57.0% | 57.0% | 57.5% | 60.9% |
| Goal/Excellence | 66.0% | 66.0% | 66.5% | 69.9% |